Economic activity in India slowed down in 2019-20 as a synchronised global downturn amplified by drags on aggregate demand took a costly toll. After remaining benign in the first half, headline inflation picked up subsequently on spikes in food price inflation. Monetary and credit conditions reflected deceleration in underlying activity in the economy. Financial markets turned volatile in the later part of the year in sync with global markets, reflecting the impact of the pandemic. Public finances recorded deviations from budgetary targets due to shortfalls in tax revenue and disinvestment collections. On the external front, the current account deficit narrowed with net capital flows remaining robust; foreign exchange reserves rose during the year

MACROECONOMIC SCENE
2.1 India's real GDP growth is estimated at 5.2 per cent in 2000-01 as against 6.4 per cent in 1999-2000 and 6.6 per cent in 1998-99. Compared with other developing countries, excluding China, as well as industrial countries, India's growth performance, despite the deceleration, has been quite favourable . The gross domestic saving rate improved moderately to 22.3 per cent in 1999-2000 from 22.0 per cent in 1998-99. The gross domestic investment rate mirrored the improvement in the saving rate. The net inflow of resources from abroad was 1.0 per cent of GDP as in the preceding year. On the supply side, real GDP growth emanating from agriculture and allied activities recorded a deceleration to 0.2 per cent in 2000-01 from 0.7 per cent during the previous year. Agricultural production, in terms of the index of agricultural production, in fact, declined by 6.5 per cent in 2000-01. Real GDP growth originating from industry slowed down to 5.3 per cent from the preceding year's level of 6.1 per cent. Industrial production, measured in terms of the index of industrial production (IIP), also decelerated to 5.1 per cent during 2000-01 from 6.7 per cent in 1999-2000 on account of pronounced slowdown in manufacturing and electricity. Althou
gh GDP growth in the services sector slackened during the year by almost 2 percentage points to 7.5 per cent, it remained close to the average of 8.5 per cent for the period 1994-2000.
FINANCIAL MARKETS
II.4.1 Global financial markets, which traded on a buoyant note during most part of 2019 and early 2020, experienced panic sell-offs across asset classes, triggered by the outbreak of COVID-19. Volatility soared to extraordinarily high levels, reminiscent of the turbulence seen during the global financial crisis . As investors scrambled into US dollar positions to seek safe haven, depreciations set in upon almost all other currencies. Bond yields firmed up on massive sell-offs, but speedy central bank actions with widespread policy rate cuts and large amounts of liquidity injection along with fiscal measures appeared to have calmed sentiment.
II.4.2 In India, equity market also fell sharply in sync with global markets with the outbreak of COVID-19. After the announcement of the corporate tax rate cut in September 2019, it made handsome gains and rose to record new highs in January 2020 on the back of positive sentiments on US-China trade talks and the likelihood of an orderly Brexit. However, this positive momentum was interrupted by the escalation of geo-political tensions between the US and Iran, weakening domestic growth prospects and higher inflation expectations. COVID-19 brought an abrupt change in sentiments in March 2020. After exhibiting range-bound two-way movements with weakening bias during first three quarters, Indian rupee depreciated to an all-time low during Q4:2019-20 on large capital outflows from both the equity and debt markets. In the money market, as detailed in sub-section 2, overnight money market rates (call money, triparty repo, and market repo) were largely aligned with the policy rates albeit with a downward bias, and were insulated from adverse global developments by proactive liquidity management by the Reserve Bank. Bond yields softened significantly during 2019-20 as discussed in sub-section 3, aided initially during H1:2019-20 by positive sentiments from the general election results, policy rate cuts, infusion of liquidity by the Reserve Bank and the possibility of the fiscal deficit slippage being contained. During H2:2019-20, yields softened further on the back of auction of special OMOs, softening of US treasury yields, easing crude oil prices and announcement of comprehensive liquidity measures on March 27, 2020 to mitigate the adverse impact of COVID-19. Sub-section 4 profiles developments in the corporate bond market wherein yields softened during 2019-20, reflecting policy rate cuts by the MPC and injection of systemic liquidity, especially through the special OMOs and Long-term Repo Operations conducted during the latter part of the year. Sub-section 5 presents developments in the domestic equity market, followed by a discussion on movements in the Indian rupee in the foreign exchange market in sub-section 6. The section concludes with some forward-looking perspectives.
2. Money Market
II.4.3 The money market remained generally stable during 2019-20, especially in H1. In the second half of the year, bouts of volatility, mainly in March 2020 on account of the spread of COVID-19, dispelled the calm.
II.4.4 Beginning June 2019, liquidity conditions transited gradually out of deficit conditions during Q1:2019-20. The Reserve Bank proactively managed frictional liquidity conditions with a slew of conventional liquidity measures, reduction in the CRR and easing of daily maintenance requirements, variable and fixed rate repos/ reverse repos of various tenors and access to the Marginal Standing Facility as well as several unconventional measures, including long-term repo operations , targeted long-term repo operations, line of credit to financial institutions, and a special liquidity facility for mutual funds .
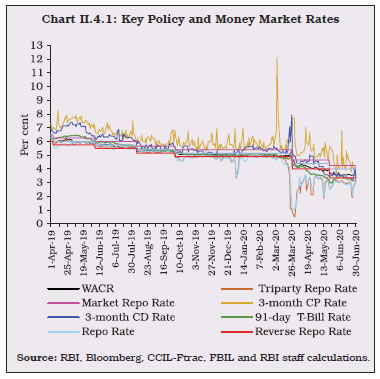
II.4.5 The weighted average call rate in the unsecured inter-bank call money market remained aligned with the policy repo rate during the year with a downward bias . The average absolute spread of the WACR over the policy rate increased to 11 basis points (bps) in 2019-20 from 9 bps in 2018-19, as surplus liquidity conditions prevailed in the banking system for most of the year.
II.4.6 Volatility in the call money segment, measured by the coefficient of variation of the WACR, increased to 7.55 in 2019-20 from 3.40 a year ago, reflecting the swings in liquidity conditions. The triparty repo and market repo rates remained below the WACR, on average, by 22 bps each.
GOVERNMENT FINANCES
II.5.1 In 2019-20, general government finances deviated from budgetary targets. For the central government, the overshoot of 1.3 percentage points in its gross fiscal deficit (GFD) was mainly due to lower than budgeted tax collections, reflecting the growth slowdown as well as rationalisation of corporate tax rates. Thus, the central government took recourse to the escape clause under Section 4 (3) of the revised FRBM Act twice in 2019-20 – first, for its GFD being placed at 3.3 per cent of GDP in the budget estimates (0.2 percentage points above the glide path specified in 2018-19) on account of GST stabilisation and second, for the GFD overshooting to 3.8 per cent in its revised estimates . As per provisional accounts , however, the central government’s realised GFD reached 4.6 per cent. In the case of states, the consolidated GFD deviated from the budgeted level, again mainly on account of lower revenue collections.


